Dashboard

NoSky Backup Platform - Cloud Infrastructure Backup Monitoring System

Enterprise SaaS platform designed to automate infrastructure backups, monitor backup health across devices, and restore critical files securely through a centralized monitoring dashboard.

Product DesignSaaS DashboardCloud InfrastructureEnterprise UXData Backup PlatformMonitoring DashboardDesign SystemUX Strategy
NoSky Backup Platform - Cloud Infrastructure Backup Monitoring System - UI/UX design case study by Saurabh Pansari

1. Project Hero

🚀 NoSky – Enterprise Backup Monitoring Platform

NoSky is a cloud-based backup monitoring platform designed to protect enterprise infrastructure by enabling automated backups, device monitoring, and secure file restoration.

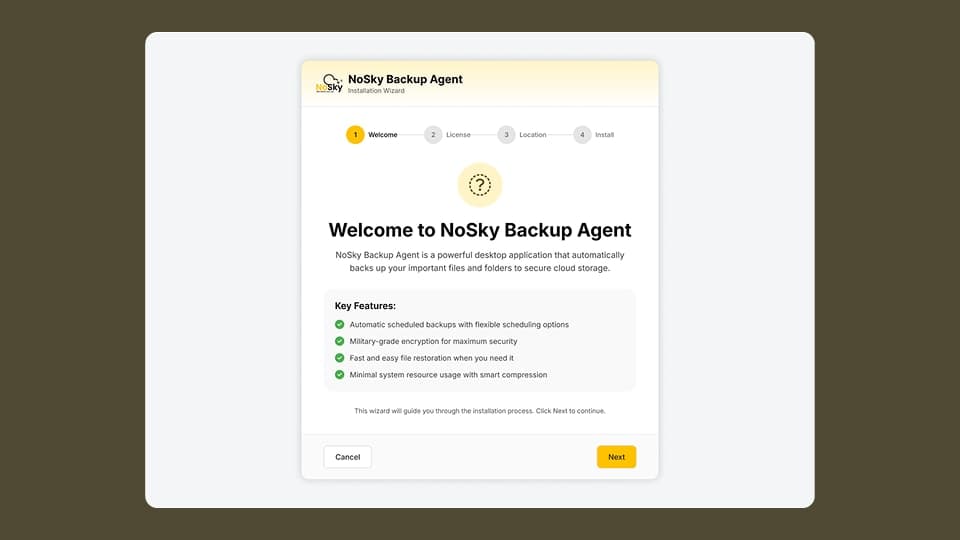
The platform combines a backup agent installed on infrastructure devices with a centralized web monitoring portal that allows administrators to monitor backups, manage backup sets, and recover files when needed.

The system was designed to support organizations operating across distributed infrastructure environments where data protection and operational visibility are critical.

Core platform capabilities

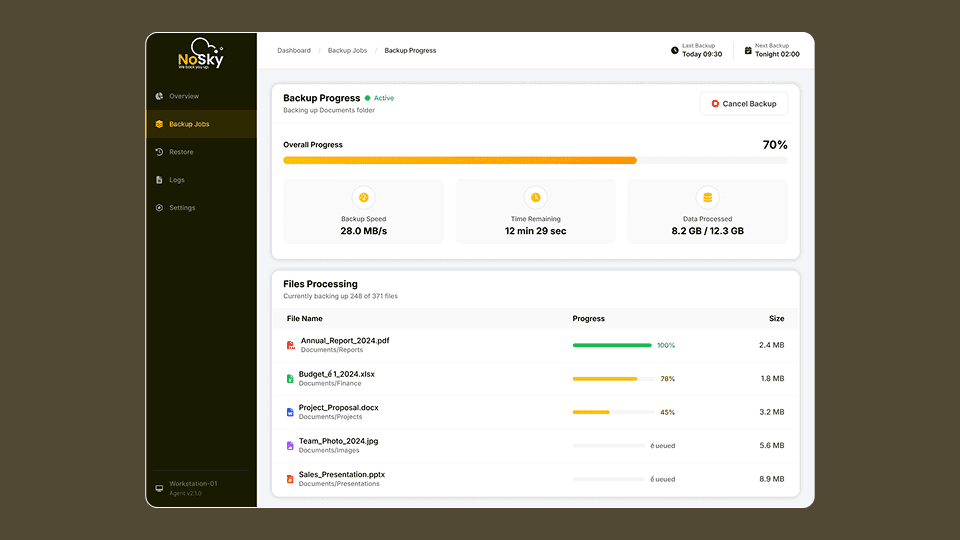
• Automated scheduled backups
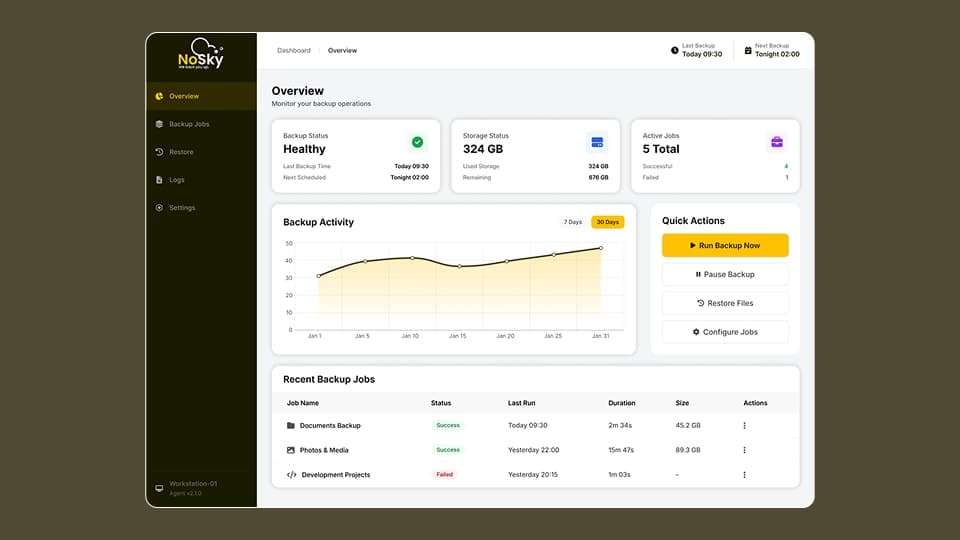
• Infrastructure monitoring dashboard
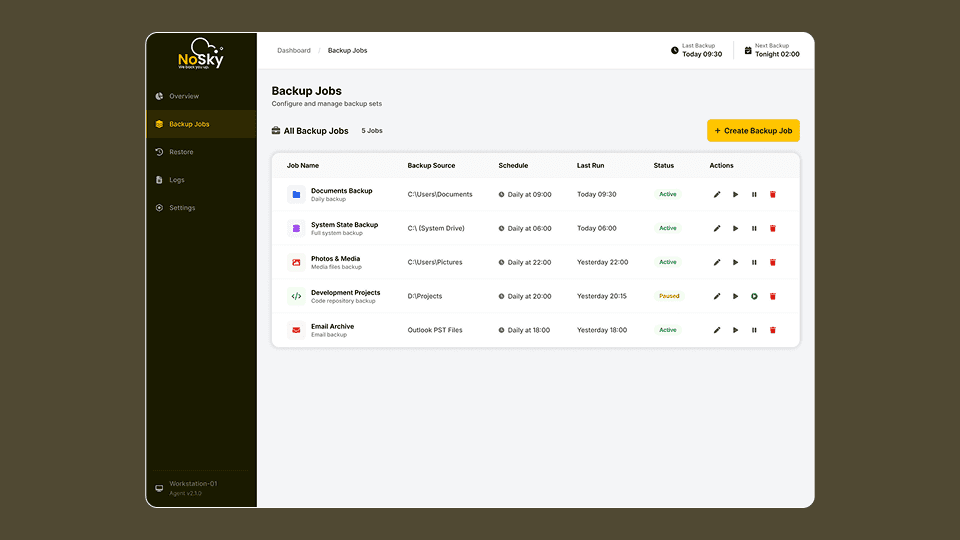
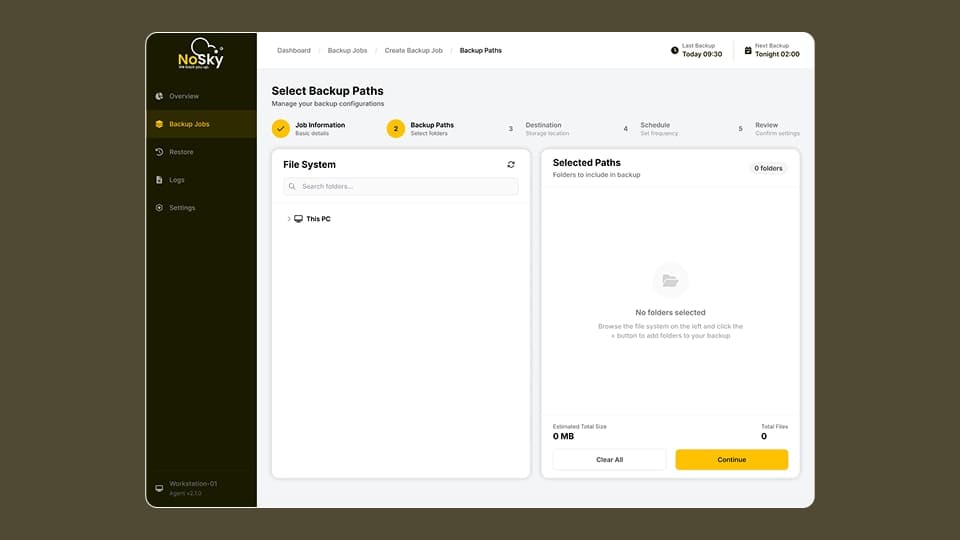
• Backup job configuration
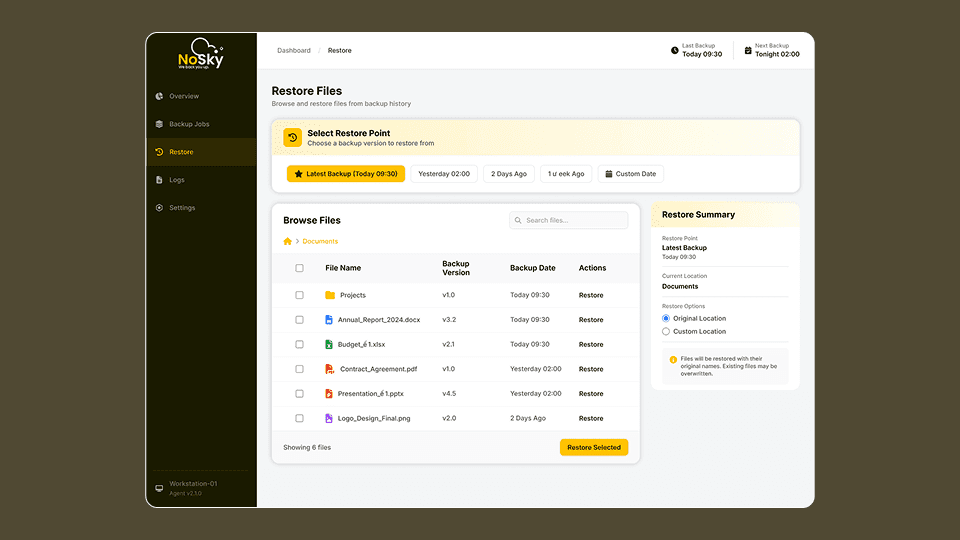
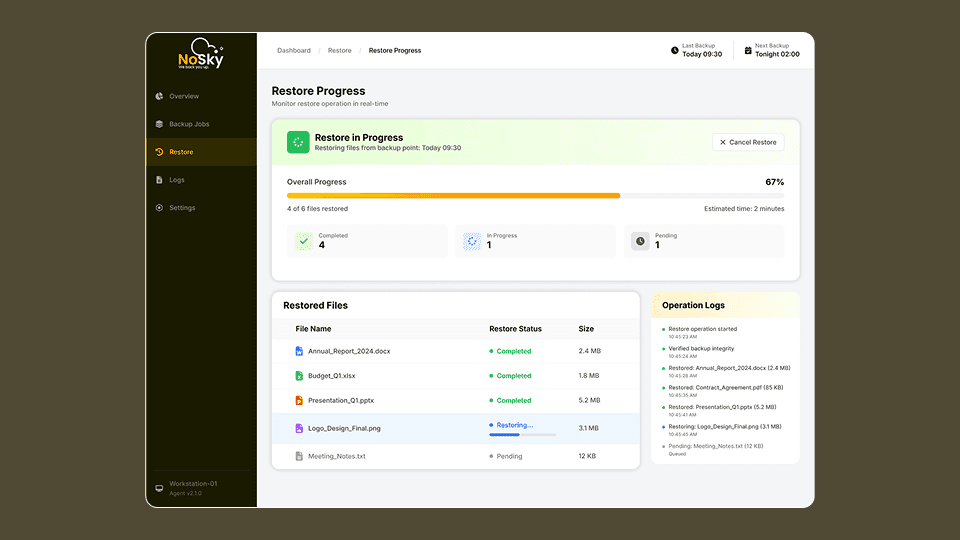
• File and folder restoration
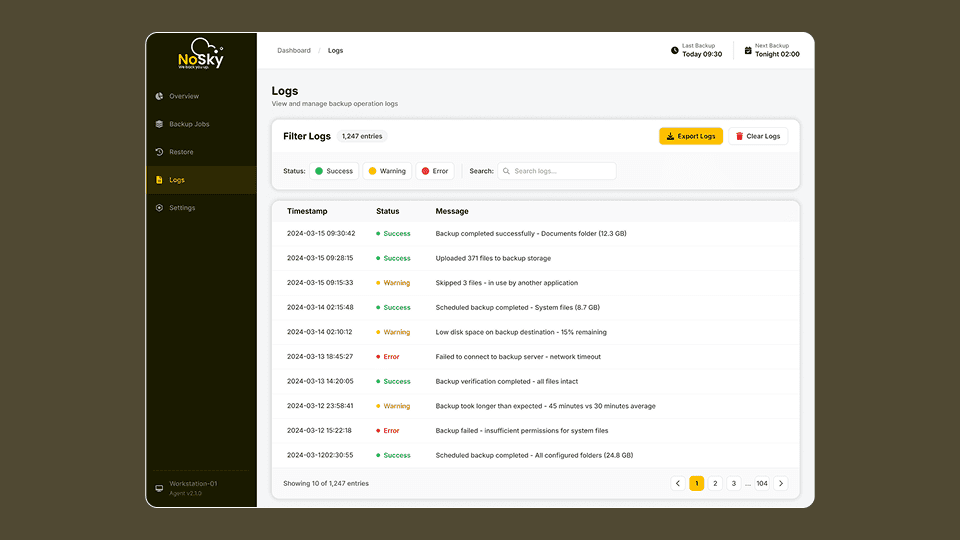
• Backup activity analytics
• Storage usage tracking

The goal of this project was to transform complex backup infrastructure operations into a clear operational dashboard that enables administrators to monitor and manage backup systems efficiently.

2. Project Context

📦 Product Context

Enterprise organizations rely on backup systems to prevent data loss caused by system failures, cyber attacks, accidental deletions, or hardware breakdowns.

However, many backup tools are difficult to manage because they lack intuitive operational dashboards and clear monitoring insights.

IT administrators often struggle with fragmented tools that make it difficult to understand:

• whether backups are running successfully
• which devices are currently protected
• how much storage is being consumed
• which backups failed or require attention

NoSky was designed to solve these problems by creating a centralized monitoring platform that provides operational clarity across distributed infrastructure systems.

3. Problem Statement

⚠️ Problem Statement

Organizations often run backups across multiple servers and workstations, but monitoring and managing these backups is complex.

Administrators frequently face operational challenges such as:

• limited visibility into backup health
• difficulty identifying failed backups
• complex configuration workflows
• slow recovery processes during system incidents
• lack of centralized infrastructure monitoring

Without a clear operational dashboard, administrators must rely on logs and manual checks to ensure backups are functioning correctly.

The challenge was to design a product that simplifies infrastructure backup management while maintaining enterprise-grade reliability and control.

4. Product Goals

🎯 Product Goals

The product design focused on simplifying backup operations while ensuring administrators maintain full operational visibility.

Key goals included:

• Create a centralized dashboard for backup monitoring
• Enable administrators to configure automated backup jobs
• Provide clear infrastructure health visibility
• Simplify device registration and onboarding
• Enable fast file restoration workflows

The design aimed to create a platform where administrators can quickly understand the health of their infrastructure backups and take immediate action when problems occur.

5. Target Users

👤 Target Users

The platform is primarily used by IT administrators and infrastructure engineers responsible for maintaining backup systems.

Typical responsibilities include:

• monitoring device health and connectivity
• configuring backup schedules
• diagnosing backup failures
• restoring critical files during incidents
• managing storage allocation

Because these users operate in high-responsibility environments, the interface needed to support fast decision making and operational efficiency.

6. UX Strategy

🧭 UX Strategy

The UX strategy focused on designing an operations-first interface that helps administrators understand backup system health instantly.

Three key principles guided the product experience.

Operational Visibility

The dashboard should immediately communicate system health, backup success rates, and storage usage.

Action-Oriented Design

Every screen should enable administrators to take action when issues occur.

Structured Workflows

Complex operations such as backup configuration and restore processes should follow guided workflows.

7. Design Process

🧠 Design Process

The design process followed a structured UX methodology.

1. Workflow Analysis

Understanding enterprise backup workflows including:

• device registration
• backup configuration
• monitoring backup jobs
• restoring files from backup history

2. Information Architecture

Organizing the platform into clear operational modules.

3. Interaction Design

Designing guided workflows for complex operations such as backup configuration.

4. Visual System Development

Creating a design system to maintain visual consistency across dashboards.

8. Information Architecture

🗂 Information Architecture

The platform architecture was organized around operational modules that represent the lifecycle of infrastructure backups.

Primary navigation modules include:

Overview
Devices
Backup Monitoring
Backup Sets
Restore Manager
Storage
Logs
Settings

This structure ensures administrators can move between monitoring, configuration, and recovery workflows seamlessly.

9. Operational Workflow

Operational Workflow

The platform follows a structured workflow for protecting infrastructure data.

Typical workflow includes:

1️⃣ Install backup agent on infrastructure device
2️⃣ Register the device using an organization key and device token
3️⃣ Configure backup sets and select folders
4️⃣ Schedule automated backup frequency
5️⃣ Monitor backup activity through the dashboard
6️⃣ Restore files when required

This workflow ensures organizations can secure infrastructure data with minimal operational complexity.

10. Key Screens

🖥 Key Screens

Installation Wizard

Guides administrators through the installation of the NoSky Backup Agent and explains the core capabilities of the platform.

Device Registration

Allows administrators to register devices using an organization key and device token, enabling the platform to monitor backup activity.

Overview Dashboard

Provides a high-level summary of system health including:

• last backup time
• next scheduled backup
• storage usage
• backup success rates

Backup Monitoring

Displays backup activity trends, job success metrics, and device-level backup performance.

Backup Jobs

Allows administrators to create backup configurations including job information, backup paths, scheduling rules, and destination storage.

Restore Manager

Provides a searchable interface where administrators can restore files or folders from previous backup versions.

Logs Dashboard

Displays detailed operational logs including success messages, warnings, and errors.

Key Screens 1
Key Screens 2
Key Screens 3
Key Screens 4
Key Screens 5
Key Screens 6
Key Screens 7
Key Screens 8

11. Design System

🎨 Design System

A scalable design system was created to ensure visual consistency across the platform.

The design system defines typography, color tokens, spacing, and reusable components used across dashboards.

Primary Font

Inter — selected for readability in dense dashboard environments.

Primary Brand Color

#FFC200 used for primary actions and key interface highlights. :contentReference[oaicite:2]{index=2}

Semantic Colors

• Green for success states
• Red for failures
• Orange for warnings

Component Library

Reusable components include:

• navigation sidebar
• dashboard cards
• data tables
• form inputs
• alerts and notifications

12. Data Visualization Strategy

📊 Data Visualization Strategy

The dashboard uses visual data components to help administrators monitor system performance.

Key visualization elements include:

• backup activity trend charts
• system status indicators
• device status metrics
• storage usage graphs

These visualizations help administrators quickly identify anomalies such as failed backups or offline devices.

13. Design Challenges

Design Challenges

Designing enterprise infrastructure tools introduced several challenges.

High Data Density

Backup systems generate large volumes of operational data that must remain readable.

Complex Configuration Workflows

Backup job configuration involves multiple parameters such as file paths, schedules, and storage destinations.

Failure Visibility

Administrators must immediately detect failed backups to avoid data loss.

The final design focused on clear monitoring indicators and structured workflows.

14. UX Decisions

💡 UX Decisions

Several design decisions significantly improved platform usability.

Dashboard First Approach

Operational health metrics are visible immediately when the user logs in.

Step-Based Backup Configuration

Backup job creation was structured into a step-by-step workflow to reduce configuration complexity.

Centralized Monitoring

All device backup activity can be viewed from a single dashboard.

15. Product Metrics & Success Indicators

📊 Product Metrics & Success Indicators

Success of the platform can be measured through operational improvements.

Key metrics include:

• reduction in backup failure resolution time
• faster onboarding of infrastructure devices
• improved monitoring visibility for administrators
• reduced downtime caused by backup issues

16. Impact

📈 Impact

The NoSky platform significantly improved the usability of infrastructure backup management.

Key improvements include:

• centralized monitoring of infrastructure backups
• simplified backup configuration workflows
• improved visibility into backup health
• faster recovery processes during system incidents

17. Key Learnings

📚 Key Learnings

Designing enterprise infrastructure platforms requires balancing technical complexity with usability.

Key insights include:

• operational dashboards should prioritize actionable insights
• structured workflows reduce configuration complexity
• clear system status indicators improve monitoring efficiency

18. Figma Prototype Embed